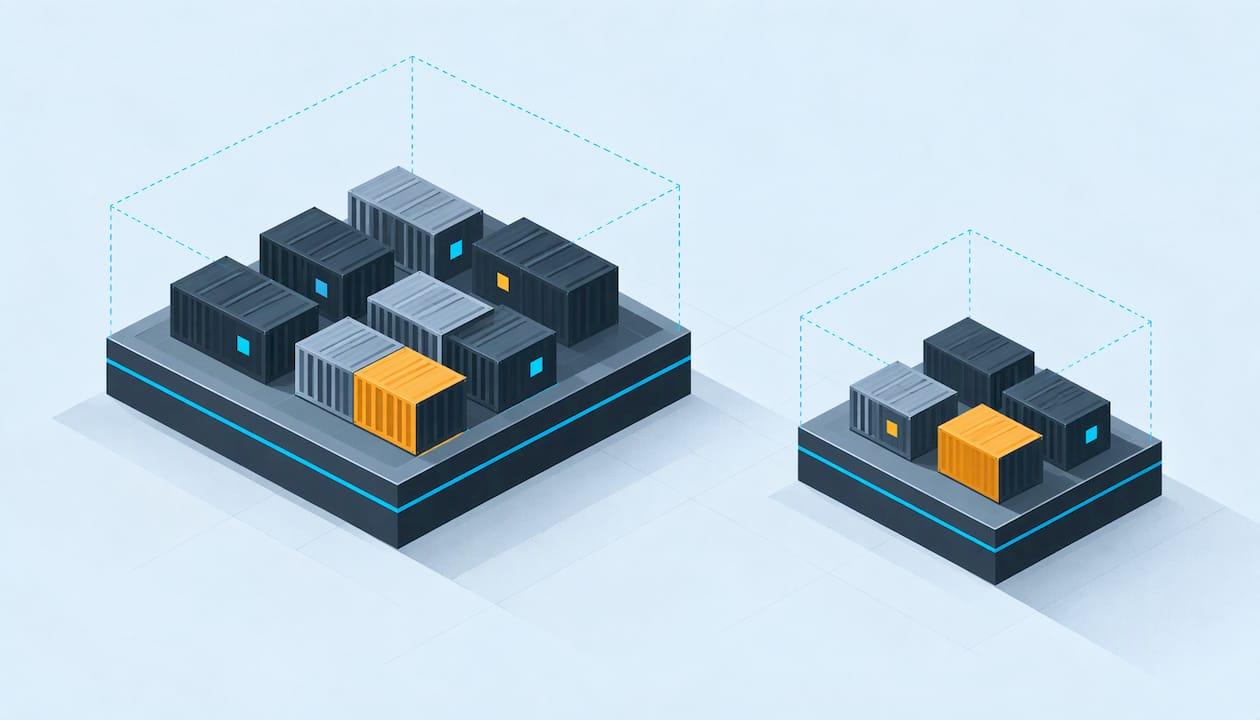
Kubernetes resource optimization means matching the CPU and memory each workload requests to what it actually needs, then keeping that match true as traffic and code change. Set requests too high and you pay for idle capacity. Set them too low and you get throttling, OOM kills and incidents. The teams that do this well treat it as a continuous loop with measured evidence and controlled rollouts, and they tie every change back to reliability, not just the cloud bill. KubeGraf is built for that loop: it investigates with evidence, prepares fixes, and applies them only after a human approves.
TL;DR
- Requests drive scheduling and cost; limits drive throttling and OOM kills. Optimization means tuning both against real usage.
- Measure over a full usage cycle, not a snapshot. Look for workloads far below or far above their requests.
- Right-size first, then autoscale: HPA for replica count, VPA for per-pod sizing, a node autoscaler for node count.
- Roll out changes gradually, watch throttling, OOM events and latency, and repeat the loop regularly.
- Every resource change is a production change. Keep a human approval step and keep your data inside your own clusters.
Table of Contents
- What Kubernetes resource optimization actually involves
- Step 1: Find the overprovisioned and underprovisioned workloads
- Step 2: Right-size requests and limits
- Step 3: Choose the right autoscaler
- Step 4: Roll out changes safely
- Why resource optimization is also an incident-prevention task
- Security and control when changes are automated
- Where KubeGraf fits
- A short checklist to take away
- FAQ
- Sources
What Kubernetes resource optimization actually involves
Every container can declare two numbers per resource: a request and a limit. The Kubernetes documentation explains that the kube-scheduler uses requests to decide where a Pod fits, while limits are enforced at runtime by the kubelet and the kernel. Exceed a CPU limit and the container is throttled. Exceed a memory limit and it can be OOM killed.
A Google Cloud engineering post on requests and limits adds two details worth remembering. A limit can never be lower than its request, and a Pod's totals are the sum of its containers' requests and limits.
This is why optimization is a balancing act:
- Requests too high: the scheduler reserves capacity nobody uses. Nodes look full while real utilization is low, and you pay for it.
- Requests too low: the scheduler packs too many Pods onto a node. Under load they compete, get throttled or get evicted.
An AWS Open Source Blog post on right-sizing makes the same point: the scheduler considers only requests, not limits. Without limits a Pod can use available host CPU until throttling kicks in, and memory exhaustion ends in an OOM kill or a kubelet eviction.
Where to start: the order of operations
AWS's EKS best-practices guide on compute and autoscaling ranks compute cost optimization in three steps: right-size workloads, reduce unused capacity, then optimize capacity types such as Spot. The same guide stresses that continually adjusting requirements matters more than getting them perfect the first time. Estimates go stale as soon as traffic patterns or code change.

That ordering matters. Buying cheaper nodes for oversized workloads, or adding autoscalers on top of bad requests, only automates the waste.
Step 1: Find the overprovisioned and underprovisioned workloads
You cannot tune what you have not measured. Start with a simple comparison of what each workload requests against what it uses.
The quick look
kubectl top pod shows current CPU and memory use, and kubectl describe nodes shows how much of each node is already requested. Together they give you a first pass at where requests and reality diverge.
Treat this as a lead, not a verdict. A snapshot misses daily and weekly patterns. A request that looks four times too large at 2 p.m. on a Tuesday may be exactly right for the batch job that runs on Sunday night.
The reliable look
For decisions, use your metrics system over a long enough window. If you run Prometheus, graph usage against requests for each container: working-set memory against the memory request, CPU usage rate against the CPU request. Use at least a full business cycle, and a month if your traffic has monthly peaks such as billing runs or reporting.
Thresholds you can borrow
There is no universal cutoff, but Google gives a concrete, documented definition. In its GKE guidance on identifying under- and overprovisioned workloads, an underprovisioned workload has CPU or memory utilization above 150% for at least 10% of the time over 15 days. An overprovisioned one sits below 50% utilization for at least 90% of that time.
The same page flags two cases that need judgment before you act on any recommendation:
- Batch workloads may intentionally run hot. High utilization is the design, not a defect.
- JVM-based workloads need extra scrutiny, because the platform has limited visibility into actual JVM memory use.
So build a short list in three buckets: clearly oversized, clearly undersized, and special cases that need an owner's input. The undersized bucket comes first, because it is where reliability is at risk.
Step 2: Right-size requests and limits
Once you know where the gaps are, set new values. Public guidance agrees on the principles even where the exact numbers differ.
Memory: protect against OOM kills
Memory is not compressible. When a container exceeds its limit, the kernel kills it. Google's cost-optimized Kubernetes guidance for GKE recommends setting the memory request and limit to the same amount. That gives the Pod a predictable footprint and avoids surprise evictions when a node runs short.
Base the value on peak working-set memory over your measurement window plus headroom, not on average use. If a Pod is already being killed, work out why before raising the number. Our guides on what OOMKilled means and how to fix it and how to find the cause of an OOMKilled pod walk through separating a leak from a genuine under-sizing.
CPU: request what you need, think hard about limits
CPU is compressible. Hitting a limit slows the container rather than killing it, which can quietly show up as latency. The same GKE guidance recommends setting the CPU request to the minimum needed for correct operation according to your service level objectives, and leaving the CPU limit unbounded. The reasoning: the request guarantees the share, and an unbounded limit lets the Pod use spare cycles on the node instead of being throttled while the node sits idle.
A worked example
Take a checkout API with three replicas, each requesting 2 CPU cores and 4 GiB of memory. Over a month of data, each replica peaks at 0.6 cores and 1.8 GiB of working-set memory, with a brief spike to 2.1 GiB during a nightly job.
- CPU: peak use is 30% of the request, well under the 50% overprovisioned line. A request of 1 core leaves room for growth and releases 3 cores across the Deployment.
- Memory: the 2.1 GiB spike sets the floor. A request and limit of 2.5 GiB covers it with headroom and frees 4.5 GiB in total.
Those numbers are illustrative, but the logic is the one you apply to every workload: take the peak across a full cycle, add headroom, and change the number in steps rather than all at once.
Keep some slack on purpose
The pull toward 100% utilization is a trap. Some idle capacity is the headroom that keeps Pods from being throttled or killed when load rises. Aim for efficient, not full.
Step 3: Choose the right autoscaler
Autoscaling is not an alternative to right-sizing. It works on top of it. The AWS EKS guidance assigns each tool a distinct job:
| Tool | What it adjusts | Use it when |
|---|---|---|
| Horizontal Pod Autoscaler (HPA) | Number of replicas | Load varies and the app scales out cleanly |
| Vertical Pod Autoscaler (VPA) | Requests and limits per replica | You need ongoing sizing recommendations or changes |
| Node autoscaler (Karpenter or Cluster Autoscaler) | Number of nodes | Pod demand changes the capacity the cluster needs |
The EKS guidance suggests starting VPA in audit mode, where it recommends values without applying them. That is a good habit regardless of platform: read the recommendations for a few weeks, compare them to your own analysis, and only then let anything act.
A practical sequence:
- Right-size requests using the evidence from step 1.
- Add HPA for workloads whose load fluctuates.
- Run VPA in recommendation mode to catch drift.
- Let the node autoscaler follow the Pods, so freed requests turn into removed nodes.
The last step is where the money shows up. Lowering requests changes nothing on your invoice until nodes actually go away.
Step 4: Roll out changes safely
Resource changes look small and can cause outages. A request cut can cause a Pod to be rescheduled onto a busier node. A lower memory limit can start an OOM loop on the first traffic spike. The EKS guidance advises reviewing and testing changes that affect production workloads in a non-production environment first.
A rollout routine that holds up:
- Change a small slice first. One service, one namespace, or one replica set before the fleet.
- Define what you will watch. CPU throttling, OOM kills and restarts, p95 and p99 latency, error rate and Pod evictions.
- Compare against a baseline from before the change, over the same kind of period.
- Hold through a peak. A change that looks fine at midday has not been tested until the busiest hour passes.
- Keep rollback one step away, ideally as a reverted commit in version control.
- Repeat on a schedule. Re-measure after major releases and on a regular cadence, since the data you sized from keeps aging.
The weak spot in most teams is steps 2 through 4. Engineers make the change and move on, and the regression surfaces a week later as an incident with no obvious cause.
Why resource optimization is also an incident-prevention task
Most writing on this topic frames it as cost cutting. For the engineers who carry the pager, it is as much about reliability.
Google Cloud's post on setting resource requests describes "at risk" clusters as those where actual utilization generally exceeds the sum of workload requests. That raises the odds of node-pressure eviction and reliability problems that are hard to debug. In practice, a misconfigured request often hides behind a symptom: a restart loop, a latency spike, an alert at 3 a.m.
That has two consequences for how you run optimization:
- Every change needs a cause-and-effect trail. When something breaks after a resource tweak, you want to see the change, the metrics around it and the affected workloads in one place.
- Noise matters. If your team already drowns in alerts, adding throttling and OOM alerts without context makes things worse. Our piece on Kubernetes alert fatigue covers how to keep signal high.
If cost is your main driver, our Kubernetes cost optimization guide goes deeper on cloud spend. If incidents are, reducing MTTR in Kubernetes incident management is the better companion read.
Security and control when changes are automated
Automating resource changes raises a fair question: who is allowed to change production, and where does your data go? Two principles keep this safe.
Human approval for production changes. Recommendations can be automatic. Applying them should pass through a person or a policy that a person owns. Without that, an autoscaler or a script can resize a critical service at the worst moment.
Data stays where you control it. Resource and workload data reveals your architecture, your traffic patterns and your internal service names. For security-minded teams, tooling that analyzes this inside your own clusters is easier to approve than tooling that ships it out.
Where KubeGraf fits
KubeGraf is an autonomous AI SRE tool for Kubernetes. Its multi-agent workflow detects anomalies, runs root cause analysis backed by evidence, and prepares fixes. Those fixes go through SafeFix, which is policy-controlled and requires human approval before anything is applied. For code-level changes, it works through GitOps pull request workflows, so a resource change is reviewed like any other change and reverts like one.

It operates within your own clusters to maintain data privacy, offers customer-hosted deployment, and integrates with popular observability and cloud tools. It also includes cost intelligence for cloud spend optimization, so the same platform that investigates a throttling incident can show where requests are inflating your bill.
The Pro plan is $799 per month, and Enterprise plans are custom, with terms covering node capacity, AI allowances and support. You can also look at the Freemium option or see the KubeGraf platform overview.

If your team spends more time explaining why a Pod was killed than preventing the next one, start with the platform page and map it to your own cluster tooling.
A short checklist to take away
- List workloads by requested versus used CPU and memory over a full cycle.
- Separate oversized, undersized and special cases such as batch and JVM services.
- Fix undersized workloads first, since they carry incident risk.
- Set memory request equal to limit, and size CPU requests to your SLOs.
- Add HPA, run VPA in recommendation mode, and let node autoscaling reclaim capacity.
- Test in non-production, roll out in slices, and watch throttling, OOM events and latency.
- Route changes through approval and version control.
- Re-measure regularly.
FAQ
What is the difference between resource requests and limits in Kubernetes?
A request is the amount of CPU or memory the scheduler reserves for a container when placing its Pod. A limit is the cap enforced at runtime. According to the Kubernetes documentation, going over a CPU limit throttles the container, while going over a memory limit can get it OOM killed.
Should I remove CPU limits?
Google's GKE cost-optimization guidance recommends an unbounded CPU limit alongside a CPU request sized to your SLOs. That lets a Pod use spare node capacity instead of being throttled. Memory is different: set the memory limit, typically equal to the request.
How long should I measure before changing requests?
Long enough to cover your full traffic cycle. Google's GKE definitions of over- and underprovisioning use a 15-day window, and workloads with monthly peaks need longer. A single snapshot from kubectl top is only a starting point.
When do I use HPA, VPA or node autoscaling?
Use HPA to change replica count, VPA to adjust each replica's requests and limits, and a node autoscaler to change node count. The EKS best-practices guide suggests starting VPA in audit mode so you can review its recommendations before it changes anything.
Sources
- Resource Management for Pods and Containers, Kubernetes documentation
- Compute and Autoscaling, Amazon EKS best practices
- Right-size your Kubernetes applications, AWS Open Source Blog
- Kubernetes requests vs limits, Google Cloud blog
- Identify underprovisioned and overprovisioned workloads, GKE documentation
- Best practices for running cost-optimized Kubernetes applications on GKE
- Setting resource requests: the key to Kubernetes cost optimization, Google Cloud blog
Recommended
- Kubernetes Cost Optimization in 2026: The DevOps Engineer's Guide to Cutting Cloud Spend 30%+ Without Touching Workloads
- Downtime Is a Balance-Sheet Problem: Reducing Kubernetes Risk With KubeGraf
- Kubernetes Incident Management: How to Reduce MTTR by 80%
- KubeGraf for SRE Teams: Cut Toil, Protect Error Budgets, Reclaim Your On-Call